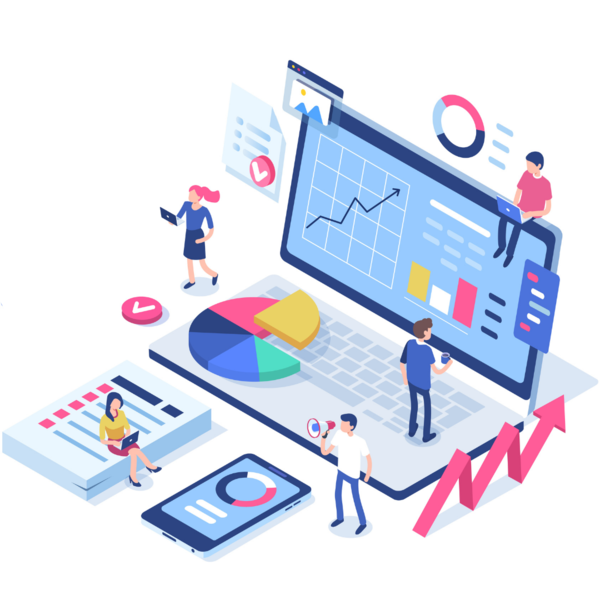
Why do you need web analytics?

Most companies realise the power of the Internet and invest time and money in online promotion. But too many of them do it ineffectively. Up to 90% of the marketing budget is wasted on what could have been skipped, or made smarter.
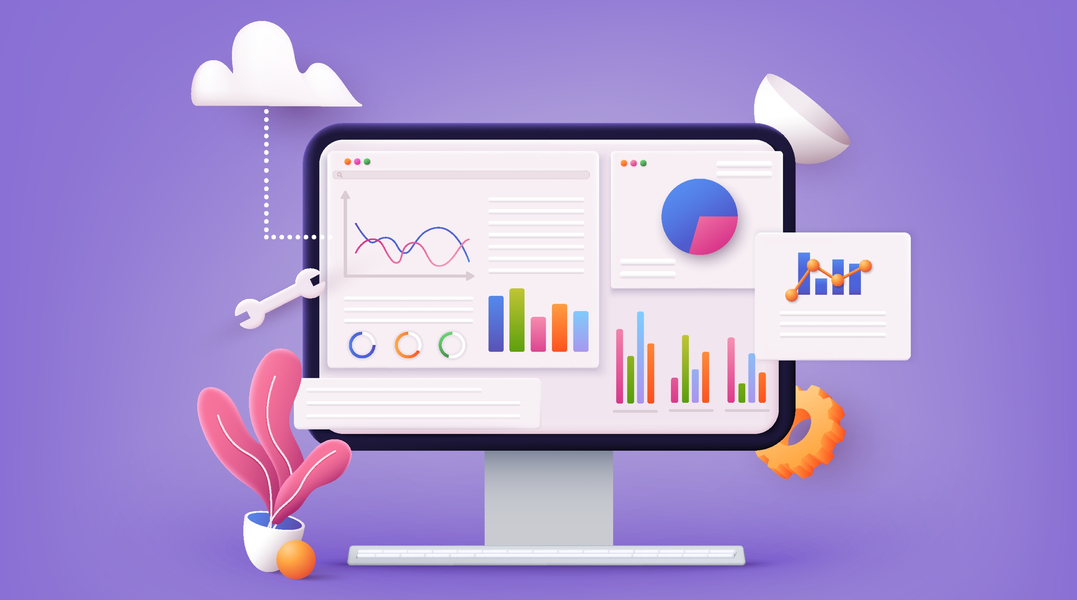
Analytics mainly serve the purpose of optimising the financial results of your web presence. Primarily, this means that you should already have some data flow: regular targeted efforts to promote on the Internet, a certain budget spent on advertising and content creation, search engine optimisation and influencers.
If you are already spending money on these, you probably want to understand what effect you get from every dollar invested in this or that channel, this or that campaign, this or that advertising message …
You can increase investments in tools that generate better results and vice versa.
But web analytics helps you not only to decide WHERE to invest your marketing budget, but also HOW to improve tools that generate comparatively poor results.

web analytics investment

Electronic commerce

Success in eCommerce depends on web analytics more than in any other sector. The point is that many online stores sell the same products and provide the same service. Among themselves, they mostly compete in accuracy of targeting for the interests of their audience.

High-quality and continuous web analytics allows a web store to improve sales without additional costs associated with traffic generation. This is possible once you know:

  • How users get to your website or social platforms with embedded checkout functionality;
  • What need brings them to your online store, what their life circumstances are (especially important for goods connected with main life events like birth, death, wedding, etc.);
  • Who these users are, what they are fond of, how they use the Internet, what their beliefs and fears are;
  • With what expectations they come to your online store (expectations depend on what you promised them at the previous step, say, in the ads);
  • How the users transition through the principal steps to conversion: awareness, recognition of a need, desire to buy, decision to purchase it from you… this process may happen over the course of months as a result of reading different product descriptions, news articles, social media posts – not only yours;
  • How users behave on your website;
  • What days of the week, what hours they mostly visit your website;
  • How often a typical user uses your site;
  • What problems they face when using your online store;
  • What emotions they experience in the process of using your and other online stores (and what elements make them cringe or furiously shout at the monitors);
  • The list goes on.

ecommerce analytics


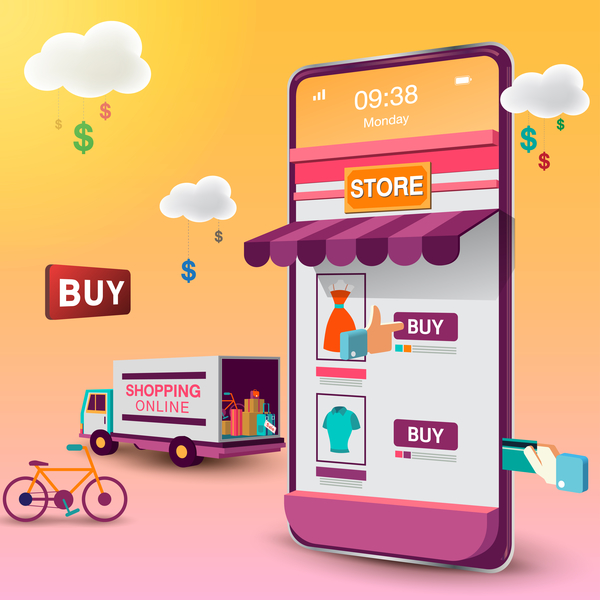
Example – an online electronics store

Let’s say you have a website that sells electronics and household appliances. The website has 10 thousand visitors a day, and only 10 of them, on average, place an order. So, are the other 9,990 coming in just for fun?

If you carefully analyse the process of searching for goods, filling the basket and placing an order, you can see that 1000 users quit at the stage of filling the data for delivery. This is incredibly annoying: 1000 people daily make efforts to find and put some of your products in their carts, proceed to checkout, and in the middle of the checkout flow something gets in their way. They leave upset and missing some much needed products. We need to save them!

To do so, we will utilise some special web analytics tools:

  • Sequential conversion counters along every step of the shopping process, which allow you to localise the steps in the process on your website where most users encounter a problem (a sort of bottlenecks);
  • Viewing videos of individual visits of specific real users (no personal data collected though); we study very carefully the step where most people stumble, and understand what exactly happens there. Through tracking the mouse movements and button clicks, it becomes clear what causes the difficulty for the users.

What are the typical problems you can see? Here are a few that we often see on other websites:

  • A sudden increase in the  order amount, say, due to delivery, which the user was not warned about;
  • Failure to select the correct postcode;
  • Irrelevant additional offers popping up and annoying the user.

As soon as we understand where the problem is and what the problem is, we fix it and immediately see the sales grow exponentially. Those 1000 users who used to leave with nothing in their hands now leave with their purchases. This is why promises like “we will increase your sales by 10 times” are often close to the truth.

Solve a Buyer’s Problem and Get Rewarded!

Both for eCommerce and for corporate sites, the convenience of performing interactive functions, especially feedback forms, is of great importance. The general principle is that for success, each feedback form should be as short as possible, all fields in it clear, the rules for entering data (for example, phone number validation) should be helping the user, rather than interfering.

To understand how to improve the feedback form, you just need to know who your users are, what they are interested in, where they are coming to your website from. Also it is advisable to know the specific difficulty they are currently experiencing in filling out the form.

Once you’ve made the process of submitting data more intuitive, the number of sales (or the number of leads, if this is a lead-generation website) can easily double: this is possible if the site owner has taken care of attracting a lot of potential customers, but ignored the poor usability of the website itself that turns it into the impenetrable jungle for the user.

blogs and web portals analytics


Blogs and web portals

Blogs, web portals and all kinds of content publishers need analytics to produce better content and create a more efficient environment where the users can easily get the information they need and also take advantage of the special offers that are present on the website. After all, these websites usually make money by advertising or otherwise promoting products and services: either as regular display ads, or in a more native form, through articles that casually mention the advertiser’s product. Either way, the user should be comfortable using the free features of the website (for instance, driving the user crazy with endless pop-up windows with special offers is a bad idea), as well as following the commercial links if interested.

Analytics helps you figure out what effect certain content or functional elements have. You can also figure out which layout solutions are the most advantageous in terms of the placement of ad units and free content. As a result of analytics, the website owner is sure to understand their users very well: who they are, what they are interested in, how often they visit the website, etc.
Based on this knowledge, one can optimise the website by improving its aspects: content topics and styles, size of content, the way the information is presented, the format choice (multimedia or text), web page layout, location of links, buttons and banners on pages with content, main menu and other internal navigation tools. This work is pretty multifaceted and requires profound awareness of the user behaviour specifics on your website.
If you continually update your understanding of the audience and their website usage patterns, you can continually improve your website’s performance, popularity, attractiveness to advertisers, and thus your placement price.

A / B tests

Web analytics is closely intertwined with website refinement and optimisation. This is an iterative process where a / b tests (or split tests) play an important role.
Based on the results of the analytics, we find out what difficulties users have, or what important elements they do not notice, and put forward hypotheses about which change will help them.
Next, we develop a slightly different version of the page or the element that is apparently not good enough, and then randomly direct part of the users to the old version, and other users to the new version using the dedicated functionality of the web platform. We then monitor the performance of the two versions using web analytics tools for a few days. If we see that the effectiveness of the new version is higher, we save it as the main one. If its effectiveness turns out to be lower, we rollback the change and think how else we can change this element so that it becomes more effective and helps you earn more.
Using a / b tests, you can optimise the web page content and layout (separately for desktop and mobile), as well as functional elements, navigation elements, etc.

a/b testing

Website as a path to the user’s goal

As a website owner, you have a goal: to make money, attract fans or make the world a better place …
To achieve your goal, you must help the maximum number of site users achieve THEIR goals: buy the necessary product, get the coveted content, participate in an online event, etc. The ultimate goal of a user on your website is called a macro conversion. A certain path leads to it, passing through a series of intermediate points – micro conversions. The typical path of steps from the moment they enter the website to the moment of the macro conversion is called the “user journey”.
Until recently, the user journey concept seemed pretty straightforward. It was a chain of steps from the beginning to the goal, and all users went through it more or less similarly.
Marketing activities in this context boiled down to raising awareness and interest of the future consumer. You simply had to lure the user to the website with an engaging advertisement, show them suitable products, convince them to buy something, ensure a convenient purchasing and checkout process, or in some cases consult them on the phone at the right time. If the user has left without purchasing anything, they also encounter displaying ads delivered by retargeting.

Today, customers have more control over the process of using the website, and in general, the interaction with the brand. They can enter at any step of the user journey. Moreover, there are many different user journeys at the user’s disposal, that is, there are many ways to make a purchase or to decide to work with your company. Some purchases can be made entirely on Instagram; some cases require a long study and a lot of consultations; sometimes the user needs to be shown a necessary article or clip on time, which will help the user not only understand the benefits of the product, but also understand how to actually use this product.
Many possible entry points and exit points, many possible intermediate steps have turned the user journey from a chain (or a funnel) into a network of paths. Some of these paths prove the most convenient and trodden, others are more exotic; some cost you more money (due to retargeting, mailings, bloggers), some are free; some paths provide high conversion, some no conversion. It is important to identify the most efficient paths and try to minimise their cost; on the contrary, low-converting expensive paths either should be optimised to start generating conversions, or you should stop investing in them.
At the same time, one must never forget about micro conversions: after all, it so happens that a certain intermediate step in the user journey may be quite expensive (for example, advertising with a blogger) and never leading to macro-conversions itself, but once you turn it off, 80% of macro conversions disappear because they happened somewhere further, many steps after reading that blog post. To know about this, you need smart web analytics and intellectual micro conversion attribution (there are tools based on artificial intelligence dedicated to such attribution and campaign design decisions).

A modern marketer should predict where the clients will appear and show them the appropriate message – as he expects. Knowledge of these states can be achieved by analysing the behaviour of potential customers moving through all marketing channels.

Quantitative and qualitative data

In Web Analytics, both quantitative and qualitative data are important. Quantitative data can help pinpoint the location of a problem (for example, an order form), while qualitative data can indicate the cause of the problem. In combination, they give a complete understanding of each segment of the audience, their needs, the cost to attract them, and the potential value of (expected revenue from) each segment.

As a result of professional work with data, you get comprehensive representation of people who interact with the website instead of endless panels of incomprehensible numbers. You get a clear understanding of what they are interested in, what moments on the site cause them difficulties, and how to help them achieve their cherished goal (conversion) … One glance at the graph is enough to understand: “Yeah, it’s the schoolchildren’s mothers who have come to our website, looks like the school year prep season has begun; yeah, business owners read our last article about changes to the tax regime, so we need to offer them legal assistance”; etc.

As a result of a good understanding of your audience, you will not only be able to earn more and improve your image in their eyes, but you will also see a greater reward from your work. Running an online business will be a real source of pleasure for you and your employees: you will find yourself working with a living market, not with the insensible abyss of a computer network. Your emotional burnout will be gone, and your employees will feel more motivated and interested in their work too.

profitable web analytics

Comments

Leave a Reply

Your email address will not be published. Required fields are marked *